TIMEMAPS
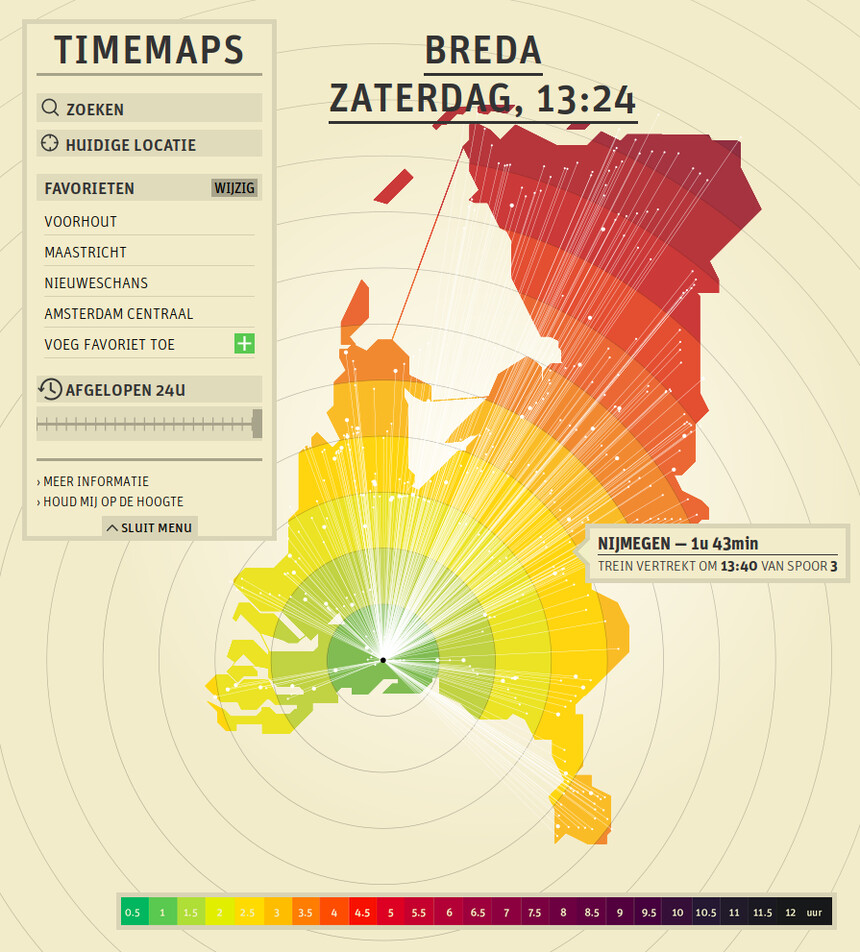
A real-time visualization of how the map of the Netherlands would look if it would be scaled proportionally to the travel times (by train) between cities.
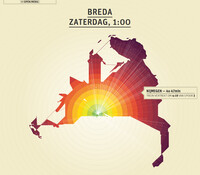
Due to the good public transportation in the Netherlands, distance has become irrelevant. We can reach almost any destination by train easily and relatively quick. In our busy lives we now think in time rather than distance. Therefore the current maps, as we know them today, are obsolete. Thinking in time affects a map and hence the shape of the Netherlands also depending on the perspective from which we look. [...] At night the map of the Netherlands will expand because there are no night trains and in the morning it will shrink once trains will commence their schedules. (text: Vincent Meertens)
This project is the idea of Vincent Meertens, graduate of the Design Academy Eindhoven. MiracleThings was asked by Vincent to transform his static, manually crafted PDF files into a real-time, interactive visualization. TIMEMAPS will be exhibited at the Graduation Show event during the Dutch Design Week 2011.
The map is a real-time interactive map. Clicking a city allows one to set the perspective to a city of his choice. Hovering the map shows a pop-up which highlights the time it takes to travel to the city the mouse is currently over. Every coloured "ring" on the map denotes 30 minutes of travel time, at the current time.
Further interactive features include a history function allows you to scroll back in time the last 24 hours, to see how the map would have looked at earlier time points; automatic geo-positioning based on browser location; searching for cities by entering their name; and a list of favorites to quickly jump between frequently visited cities.
Technologies used
This project uses the HTML5 <canvas> to draw and animate the map. It has been optimized to work at a big vertical 27" screen (1.5x full HD), as well as to scale down to fit on lower-res devices like the iPhone.
On the Zotonic-powered backend there is an Erlang crawler process which continiously polls the NS API to fetch the most up-to-date plannings and departure times for most stations. Since the API is limited to 50.000 calls per day, historical planning data of earlier days and a static travel-time table is used to fill in the blanks of the "fresh" data.
In the course of the following months, the backend code will prepared for a release as open source software.
More images
« Previous project Next project »


Hi,
Any word on when the software will be released? I'm very interested in trying to make a timemap for where I live! (Glasgow, UK) I'm looking at high speed rail travel in the UK for my Masters thesis.
Great work!
Cheers,
Alastair
Posted by Al, on 25 November 2011.